days day
hours hour
minutes minute
seconds second

The time has come folks, you can finally say your goodbyes to the average position metric in Google Ads.
As of September 30th, 2019, the metric will no longer be available to advertisers.
If you missed the initial announcement in February, Google gave us good warning of the ‘sunsetting’ plan and have now finalised the move with a final announcement, saying:
“We’re removing the average position metric from Google Ads starting the week of September 30, 2019. Moving forward, we recommend using Search top impression rate and Search absolute top impression rate. These metrics reflect the actual placement of your ad on the page, rather than the position of your ad compared to others.”
Along with the metric being removed, so will the following:
As touched on above, Google has been kind enough to supply us with two new metrics:
Search absolute top impression rate (Impr. (Abs. Top) %) – This is the percentage of your impressions that your advert was shown at the top, in position 1.
Search top impression rate (Impr. (Top) %) – This is the percentage of your impressions that your advert was shown above organic search results, between positions 2-4.
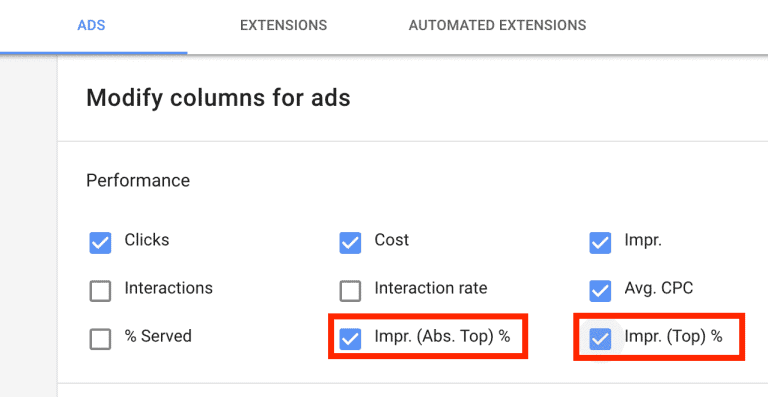
With this change, comes confusion and uncertainty.
Previously, we have had the luxury of seeing exactly where our adverts were showing and, based on that and the performance, we could adjust our bids accordingly.
However, with Google pushing automation at advertisers, in forms such as Smart Shopping or Target CPA, it seems the future is going towards handing the controls over to Google and letting go of our data–this is not the way to do things in our eyes.
Luckily, we have until September 30th to use the average position metric alongside the two new metrics.
We would recommend doing so, to give you a clear picture of your performance and to get in some practice before it is completely removed.
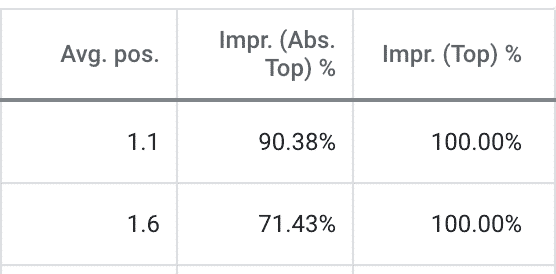
As we can see from the image above, even in position 1.1, Google is saying that 10% of the time we aren’t showing in the absolute top.
Without the average position metric, you need to pay attention to both metrics. In example 1, we are losing 10% of impressions in the top spot, this isn’t really anything to worry about.
In example 2, we are losing 29% of impressions in the top spot. Depending on performance, this also isn’t anything major.
Either way, both numbers here are healthy. Make the most of the time available now to get used to roughly which numbers correlate to which position.
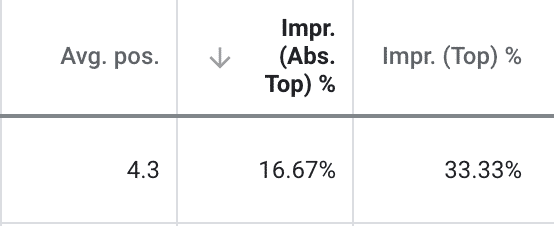
In this example, it would be time to worry.
When both Impr. (Abs Top) % and Impr. (Top) % are showing numbers like this, you need to push your bids ASAP.
Only showing in top positions 33% of the time most likely isn’t going to yield the highest results.
Keep an eye out for these low numbers, as going forward they are going to be key indicators for when you need to push your bids.
Top tip: Instead of trying to max out both Impr. (Abs Top) % and Impr. (Top) %, adjust your bids according to whether your keywords are also hitting their KPIs/targets. For example, if a keyword is overachieving on its Target CPA or ROAS and we are only hitting 60% on Impr. (Top) %, we know we can safely push the bids as we have more impressions to get.
Making this transition isn’t going to be the easiest for some, but never fear, we are all in this together.
If you haven’t been testing manual bidding vs. automated bidding strategies, now is the time to pick up the pace.
When utilising automated bidding strategies, Google takes care of everything for you, such as your bids and even your average positions.
Of course, this isn’t right for every campaign, but our belief is that it is essential to growing and developing a high performing PPC account.
Test, experiment, develop and grow.
